
MARKET OVERVIEW
As we begin 2023, the commercial property insurance market continues to face several material challenges. Macro factors include both extreme weather events and sustained inflation, placing pressure on insurance and reinsurance companies and driving premium increases throughout the US property arena. As the industry responds to Ian from the 2022 hurricane season, several insurance companies and managing general agent underwriting facilities have introduced more restrictive terms and conditions along with increased insurance rates on their catastrophe (CAT) capacity. Delegated authority has been reduced in some instances, with the variation depending on territory, occupancy, claim history and strength of the trading relationship. Loss-free non-CAT business has remained less affected, with rate increases in the low-to-mid single-digit range.
The Wholesale & Specialty Insurance Association (WSIA) Stamping Office Premium and Transaction Report - Annual 2022 confirmed the continued expansion of the excess & surplus (E&S) lines sector, with a 24.1% growth rate for 2022 representing the largest year-over-year expansion in stamping office premium since the association began recording data in 2009.
This expanded flow of business into the excess & surplus lines segment of the market continues to impact the property market, with increased submissions to underwriters. Workloads have grown significantly, making quality submissions more important than ever before. It is vital that insureds work closely with their retail brokers and wholesale trading partners to ensure their submissions clearly and effectively outline all important details for underwriters, creating the best conditions for the review process and subsequent negotiations.
MARKET IMPACT
We expect rates in the property market will continue to increase throughout the coming months, as key wind-driven account renewals will determine the trajectory of rate hikes. The magnitude of rate increases is difficult to predict and will depend on specific account risk profiles and their industry class segment. We expect CAT wind capacity deployment will continue to be more constricted and tightly controlled. Toward the end of 2022, we saw the most significant rate increases have been found on loss-driven accounts, risks with a heavy catastrophic footprint and challenging occupancies. In contrast, accounts which have performed well from a loss perspective and insureds committed to risk management improvements, are able to obtain more favorable renewal outcomes albeit still with rate increases. Another area where insureds can improve their position in today’s challenging commercial property market is by increasing self-retention levels. Increasing self- insured retentions allows insureds the ability to stay above normal loss expectancies, which can allow for underwriting credit by insurance company underwriters with a reduction in attritional loss frequency. In addition to higher retention programs, insureds are now evaluating other alternative risk options, such as parametric products, financing strategies and captive utilization.
Restrictions in policy terms and conditions, which escalated following the outbreak of the COVID-19 pandemic, have now become more standard in nature and remain primarily focused on communicable disease. Cyber coverage also remains a challenge to incorporate into policies with restrictive language being added, and at times, requiring monoline cyber policies to be purchased when coverage is needed. Valuations for location property values continue to be at the forefront of negotiations, and we are seeing restrictive occurrence limit of liability and / or margin clause endorsements becoming more frequent on renewals. This is a direct result of underwriting concerns for the reinforcement of property reporting of insurance to value (ITV) on scheduled statement of values (SOVs). In addition, expansive details are now more often required by insurance company underwriters for contingent business interruption exposures, with requests for disaster recovery and business continuity plans becoming more commonplace in our experience. Overall, we have seen a modest shift back to carrier- led forms, although the need to incorporate broker manuscript language on larger programs continues to be negotiated in many instances.
REINSURANCE
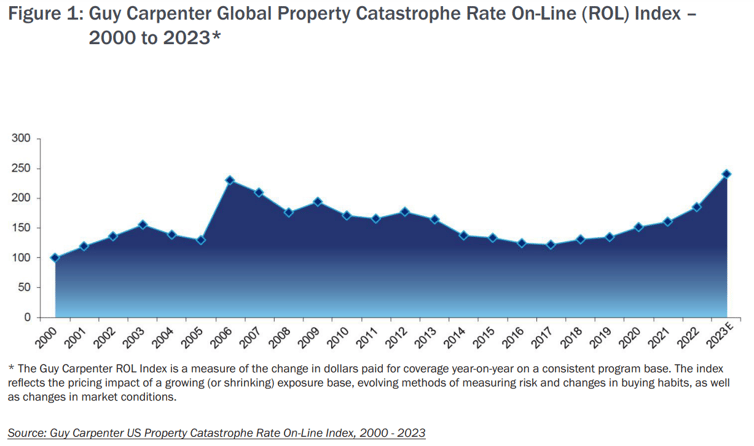
Reinsurance treaty renewals were already experiencing price hikes and capacity restrictions even prior to the September 2022 landfall of Hurricane Ian due to poor property loss experience globally. At that time, reinsurance average rate-on-line was on a path of rising 15%, which represented the largest increase in the Guy Carpenter U.S. property catastrophe rate online index since 2006. See Figure 1.
Publicly available data suggests that the January 1, 2023 reinsurance treaty renewals reflect further rate firming and reduction of available catastrophic capacity. It is our belief that the backdrop to this market environment was sewn from the confluence of several factors:
- For the past several years, insurance carriers have had much better results than their reinsurers. This imbalance (prolonged by a soft market cycle in reinsurance) stemmed from an environment of excess reinsurance capital combined with a consensus that poor underwriting results each year or two were just blips in the normal cycle of the overall market performance.
- After several consecutive industry loss events over the past few years which collectively were outside the normal expected return periods, in addition to higher-than-expected frequency and severity of storm activity, the COVID-19 pandemic, riots and wildfires, the market aggregate reinsurance capital levels have begun to erode.
- There have been substantial unrealized losses on reinsurer investment portfolios.
These factors were compounded by the inflationary impact on loss costs due to the war in Europe, pandemic-related federal monetary interventions and increasing global supply chain disruptions. All these issues, combined with a general re- examination of climate change related impacts, resulted in the market significantly re-calibrating the value of underlying exposures and expected loss costs (in both frequency and severity). This has created a perceived “new normal” for climate change- related catastrophe impacts. In addition, we have seen that other forms of reinsurance capital (retro capacity) have also tightened significantly.
More specifically on the reinsurance side, pricing and term adjustments are resulting in cedents taking greater net retentions on their “per risk” programs, requiring them to buy expanded catastrophe (CAT) excess
towers. At the same time, CAT reinsurers are now seemingly more reluctant to support lower attaching layers of CAT towers, or these reinsurers are offering pricing where cedents would be more likely to retain
these layers on a net basis. Given the expected increases in retained loss by the ceding companies in the face of greater loss expectation in the aggregate, primary companies continue to raise rates, while also reducing limits, as a strategy for managing the potentially impending margin erosion. We are seeing cedents buying more vertical limit at the top of towers in response to increased PMLs (Probable Maximum Losses) driven by the impact of inflation on the underlying exposures.
In general, we are seeing more instances where reinsurance terms and conditions are open to negotiation compared to prior years. These negotiations have resulted in significant firming in both rates and premium per unit of exposure, tighter contract language, reduced occurrence limits and tighter reinstatement provisions. Overall, risk-adjusted rate changes have ranged from mid-single digits to as much as 50% – 60% or higher, in some instances. On proportional programs, occurrence limit to premium ratios reduced in a meaningful way, and ceding commissions were also reduced significantly across many programs. Capacity shortfalls on “per risk” business seem to have instigated a shift in strategy and now weigh a greater proportion of CAT exposed reinsurance capacity towards CAT excess programs, with the expected margins in this space being viewed as the most improved. The tighter reinsurance underwriting has created, what we expect will be a sustained, firming environment versus other recent periods of market firming, which were buffered in the past due to a soft reinsurance market. It remains to be seen how much new capital will flow into the property market over the coming quarters and to what extent this flow could change the industry outlook. The consensus is that new capital in-flows will not begin in a meaningful way unless reinsurance markets demonstrate healthy returns in the coming quarters.
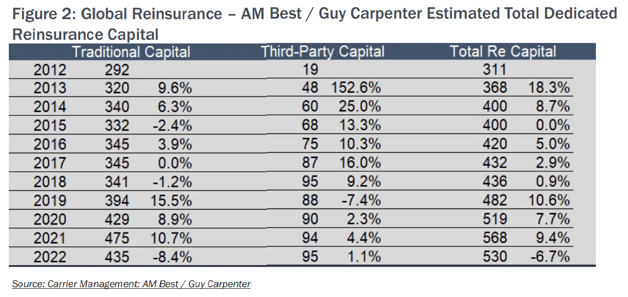
AM Best’s latest estimates project a $40 billion reduction in traditional reinsurance capital at year-end 2022. (See Figure 2) This 8.4% decline is a result of both the tailwinds of the tightening underwriting market and the headwinds of the capital and investment markets. Much of the capital behind the retrocession market is ILS, and that market cannot move capacity forward until Ian losses are more solidified. The overall lack of influx of new capital results from increasing competition from external investment opportunities.
For the retrocessional market, it seems clear that demand is outweighing supply, putting additional aggregate deployment on hold and resulting in higher prices with less capacity to offer. Recently, we believe there has been some improvement, with incremental increases in insurance linked securities (ILS) fund money helping to ease this crunch. The publicly-disclosed results of the January 1, 2023 treaty renewal activity suggest that pricing and terms are now possibly reaching a level which could satisfy the expectations of most market participants.
CATASTROPHE LOSSES
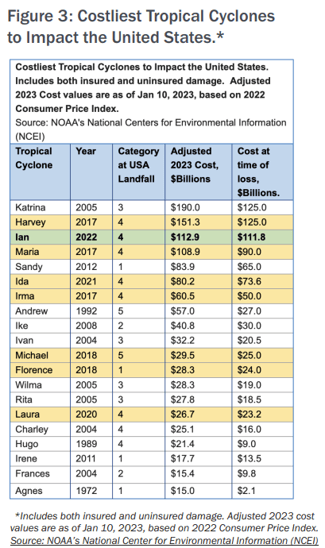
Catastrophic weather events have played a major role in shaping the insurance marketplace over the last decade, with major hurricanes making landfall in the United States five out of the last six years.
Prior to that, there were no major hurricanes making US landfall for eleven straight years, as highlighted in the National Centers for Environmental Information (NCEI) table in Figure 3.
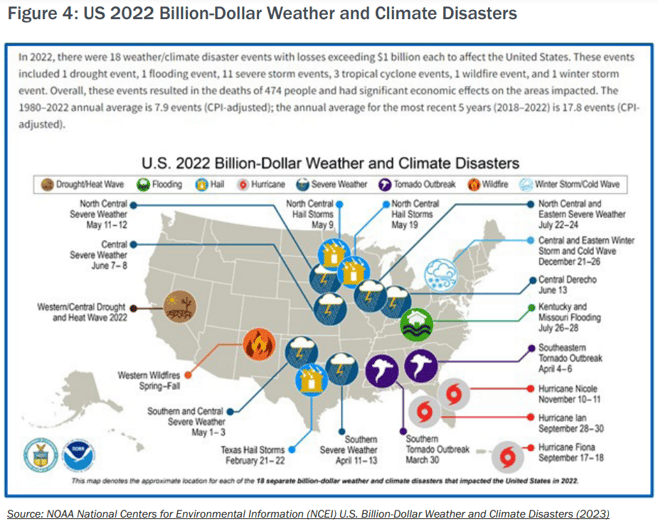
The frequency of other severe weather catastrophe types remains high, as seen in 2022 reporting by the National Oceanic and Atmospheric Administration’s (NOAA) National Centers for Environmental Information (NCEI). NCEI estimates $165 billion in economic losses, insured or uninsured, from 2022 weather and climate events. The map in Figure 4 shows events where the loss was over $1 billion each. These 18 events are consistent with the 5-year average and well over the 32-year average.
FLORIDA LEGISLATIVE UPDATE
The Florida legislature convened in December for a special session, specifically to address topics related to property insurance. During this session, Senate Bill 2-A was passed. Some of the highlights include:
- Repealing one-way attorney fees on property insurance claims
- Prohibiting the Assignments of Benefits for policies issued on or after January 1, 2023
- Changing the Bad Faith statute, requiring a court finding of breach of contract before a policyholder can sue for bad faith based on how a claim was settled
- Reducing the Claim Filing Deadline, (reduced the time from 2 years to 1 for policyholders to report a claim, and from 3 years to 18 months for a supplemental claim)
- Revising Prompt Pay Laws for property insurance. This will help expedite payments from insurance carriers.
The full legislative session recently started. There are some significant bills of interest that are floating through, currently including:
- HB 85 / SB 360: Causes of Action Based on Improvements to Real Property - shortens the timeframes within which a property owner may bring a cause of action against a builder for alleged construction defects
- HB 395 / SB 556: Hurricane Protection for Condominium Associations - concerns duties of the Condo Board, including authorizing the boards to install or require the unit owners to install hurricane protection; prohibiting the boards from refusing to approve certain hurricane protections
- SB 1174: Resolution of Disputed Property Insurance Claims – requires mediation prior to litigation
- SB 1018 / HB 859: Flood Damage Prevention – minimum freeboard requirements for new construction and substantial improvements to existing construction
- Other bills regarding insurance, applicable in the admitted market dealing with rate filings and consideration for windstorm mitigation measures in rate filings
IAN
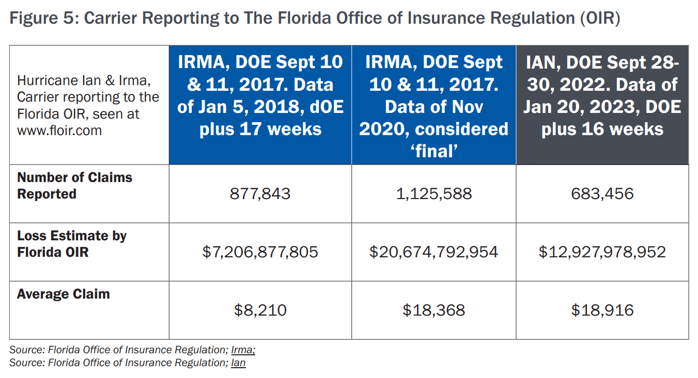
In September 2022, Hurricane Ian made landfall twice, first as a CAT-4 major hurricane, west of Fort Myers, Florida, and then returning as a CAT-1 hurricane making landfall again in Georgetown, South Carolina. According to Swiss Re, Hurricane Ian was the single largest loss-causing event in 2022 and, in December, they estimated Ian industry insured loss to be $50 - $65 billion. It is still too early to give an accurate determination of its final loss estimate. By using the table in Figure 5 of carrier reports to The Florida Office of Insurance Regulation (OIR) and then by simply applying this threefold growth of Irma losses to Ian, predictions indicate Ian insured losses could reach $40 billion. How Ian losses develop will be partly affected by the Florida legal environment and revisions made in 2022 and 2023 as outlined in the Florida Legislative Update.
HOLIDAY WINTER STORM
A major winter storm and cold blast hit the United States from December 21st to 26th during the 2022 holiday season. The strengthening storm brought more than a foot of snow and blizzard conditions across 37 states, dipping as far south as the Texas / Mexico border. According to the National Weather Service, this weather event made for the coldest Christmas in roughly 40 years for portions of the Plains and Midwest states. Freeze claims from broken water pipes and consequential water damage losses are currently being adjusted throughout the South and Southeast regions.
CALIFORNIA "ATMOSPHERIC RIVER SERIES"
A series of storms over a three-week period from December 26, 2022 through January 17, 2023 brought heavy rains, river flooding, landslides and high wind gusts across the length of California. Rain total comparisons for that period to normal annual rainfall show the storms to match 69% of San Francisco annual rainfall and 64% of
Santa Barbara’s. National Weather Service descriptive terms such as “atmospheric river” and “bomb cyclone” accent the uniqueness of these events. Moody’s RMS estimates economic damage between $5 billion and $7 billion, with insured losses between $500,000 and $1.5 billion. AM Best reports that only 2% of California residents purchase flood insurance. RMS comments that there is a significant increase in water levels of major reservoirs, but it is unlikely that these rains bring California out of the current drought.
WILDFIRES
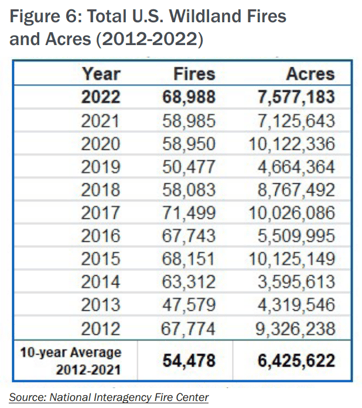
Wildfires have engulfed hundreds of thousands of acres in the United States over the last several years. In 2022, Cal Fire reports 7,667 wildfires in California over a total area of 363,939 acres, including the Mosquito Fire at 76,788 acres. No single fire made Cal Fire’s Top 20 Most Destructive list, but the count of California fires remains consistent with recent years. (See Figure 6.) National level statistics from National Interagency Fire Center (NIFC) show number of fires and acres burned in 2022 each above the prior 10-year average.
NIFC’s North American Seasonal Fire Assessment and Outlook confirms what citizens of these regions already know: “Significant drought reduction occurred in January across much of California and the Great Basin. However, drought continues in nearly half the country, with the most intense drought continuing in portions of
the southern and central Plains.” Conditions continue to support wildfires, and we expect that wildfire-exposed risks will continue to be underwritten very cautiously.
EARTHQUAKE
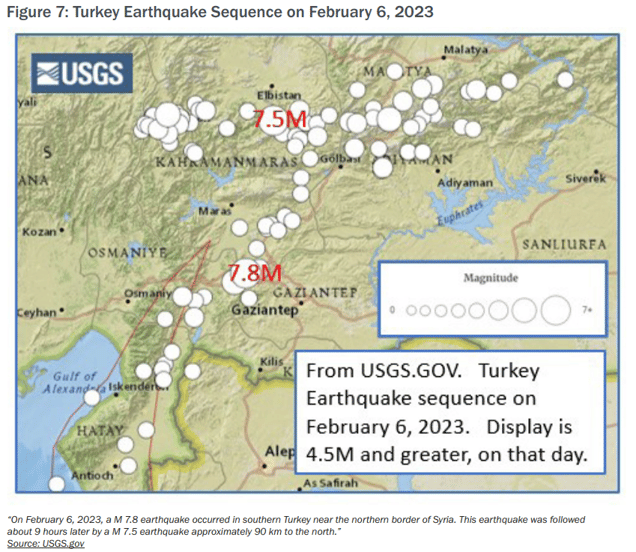
Though there haven’t been any recent notable US earthquake losses, we nonetheless anticipate that the California earthquake market will still be affected by insurer’s losses from other natural disasters. However, the effect of the Turkey earthquakes on the insurance market is projected by experts to be manageable, partly due to the low level of those purchasing earthquake insurance (See Figure 7). Verisk estimates insured losses will likely exceed US $1 billion, and Moody’s RMS estimates insured losses in Turkey are likely to exceed US $5 billion, including private insurance and in the Turkey Catastrophe Insurance Pool. Fitch Ratings says most of the insured loss is reinsured and the amount ceded is insignificant in the context of the global reinsurance market.
MARKET SPOTLIGHT: VALUATION
Insurers continue to be challenged to assess and present replacement cost values accurately due to the persistence of high inflation. Further increases in labor and material prices, along with the lingering effects of global supply chain issues, make valuations an on-going challenge. Insurers have increased their focus on ensuring that valuations reported are representative of actual exposures. This focus has a direct affect on capacity offerings, probable maximum loss calculations, minimum retention setting upon renewals and considerations with new business offerings. On larger shared and layered accounts, reporting of these insurance-to-value increases are raising the attachment points for buffer and excess layers, creating the potential need to stretch capacity or increase the number of insurers to complete the primary layers (which can possibly drive higher pricing).
COVERAGE SPOTLIGHT: BUILDER’S RISK
In the builder’s risk marketplace, adequate capacity to meet demands remains available in most segments. Yet, restrictive areas are more closely reviewed by underwriters, including coastal catastrophe areas and wood frame with high crime and wildfire exposure. More and more civil and infrastructure projects are coming online as a result of the American Infrastructure Act of 2021. Wood frame multi-family expansion is robust and reports from home builders show flat to upward growth, with many pivoting to the build-to-rent space.
We expect the coastal CAT builder’s risk arena to remain challenging post Hurricane Ian and January 2023 treaty renewals. Many of these placements remain in the admitted marketplace, though with a dramatic reduction in CAT limits and an increase in price. The excess & surplus lines market has assisted in a significant way, providing much needed capacity throughout this area.
At the end of 2022, pricing continues to press upwards, albeit on a less dramatic pace than other segments of the property market, with Florida named windstorm (NWS) capacity shifting to more of a rate-on- line (ROL) payback period approach rather than a modeled price. There is healthy competition within the small (under $25M values) to medium plus ($125M values) segments of builder’s risk projects. Almost all carriers in the builder’s risk space remain committed to active loss control and site security strategies. Sophisticated carriers are now working with vendors to raise service level standards and provide performance guarantees, which are all welcomed requirements in this space.
The global supply chain disruption continued to have an effect within the United States construction arena. Most projects experienced delays during the pandemic, with policy extensions remaining arduous. It is strongly recommended to have early communication with the insured (120 days before expiration), as updated timelines and budgets have become mandatory.
Increased rates and deductibles, in addition to possible restrictions in coverage, can be anticipated on extensions beyond pre- agreed policy terms. Projects located in heavy CAT areas and for insureds who have experienced losses can be the most susceptible to significant changes in terms and conditions.
Activity in the built-to-rent (BTR) arena remains robust. Project pipelines in this segment suggest developers expect the demand for this inventory to be accelerated by the interest rate environment, with market conditions not being conducive to home buying. With more companies embracing a work-from-home module, the lure to suburban living will likely also play a role.
THE RT SPECIALTY PROPERTY COMMITMENT
“Now more than ever, it is vital to work with a wholesale property brokerage team with strength and experience who understand the ever-changing landscape of the US commercial property arena. The RT Property team has worked hard to earn the trust of our trading partners and is well-positioned and prepared to assist retail brokers navigate the challenges faced today. Delivering customized, creative solutions is paramount to securing the best options available for insureds. Through collaboration, hard work and our commitment to excellence, the RT Property team stands ready to assist our trading partners,” says Brenda (Ballard) Austenfeld, President and Managing Director of RT Specialty’s National Property Team.
RT Property is a part of RT Specialty. RT Specialty is a division of RSG Specialty, LLC, a Delaware limited liability company based in Illinois. RSG Specialty, LLC, is a subsidiary of Ryan Specialty, LLC. RT Specialty provides wholesale insurance brokerage and other services to agents and brokers. As a wholesale broker, RT Specialty does not solicit insurance from the public. Some products may only be available in certain states, and some products may only be available from surplus lines insurers. In California: RSG Specialty Insurance Services, LLC (License #0G97516) ©2023 Ryan Specialty, LLC
This Article is provided for general information purposes only and represents RT Specialty’s opinion and observations on the current outlook of the US Property Insurance market and does not constitute professional advice. No warranties, promises, and/or representations of any kind, express or implied, are given as to the accuracy, completeness, or timeliness of the information provided in this Article. No user should act on the basis of any material contained herein without obtaining professional advice specific to their situation.