
MARKET OVERVIEW
As Q3 2023 has come to a close and we look ahead to the fast-approaching year-end, the commercial property insurance market continues to face challenges. Various insurance companies and reinsurers, along with brokers from all segments, confirm the continuation of significant loss activity in the property sector. Severe convective storms, flooding and freeze losses lead the way, confirming these risks are no longer viewed as ‘secondary perils’ as many companies are ascribing the ‘catastrophe’ (CAT) label to these losses. In the past, CAT losses were defined only as hurricane and earthquake. This definition is no longer the case with increasing storm intensity and frequency along with a broader geographical spread of losses. Rate increases continued across many lines throughout Q2 and Q3. Capacity has remained constrained for coastal accounts with many insurance companies having reduced available lines of capacity while continuing to offer coverage subject to more restrictive terms and conditions.
AM Best recently released the 2023 Surplus Lines Market Segment Report, confirming further growth and record surplus lines premium of $98.5 billion in 2022 which was up 19.2% from 2021 to 2022.
The Wholesale & Specialty Insurance Association (WSIA) Stamping Office Premium and Transaction Report – Mid-Year 2023 confirms the continued expansion of the Excess & Surplus (E&S) lines sector with a 15.9% premium growth rate for H1 2023.
With this continued growth in the E&S market, underwriters continue to be stretched with ‘deal fatigue’ becoming more relevant. The number of submissions that are not reviewed by underwriters seems to have increased in a significant way which highlights the need for well- prepared submissions with the highest quality data available. Submissions should clearly and concisely outline details of the risk in order to best facilitate underwriter review. It is critical that insureds work closely with their retail and wholesale trading partners to ensure details are updated and accurate to assist with negotiations to provide the best possible terms in today’s property market.
REINSURANCE
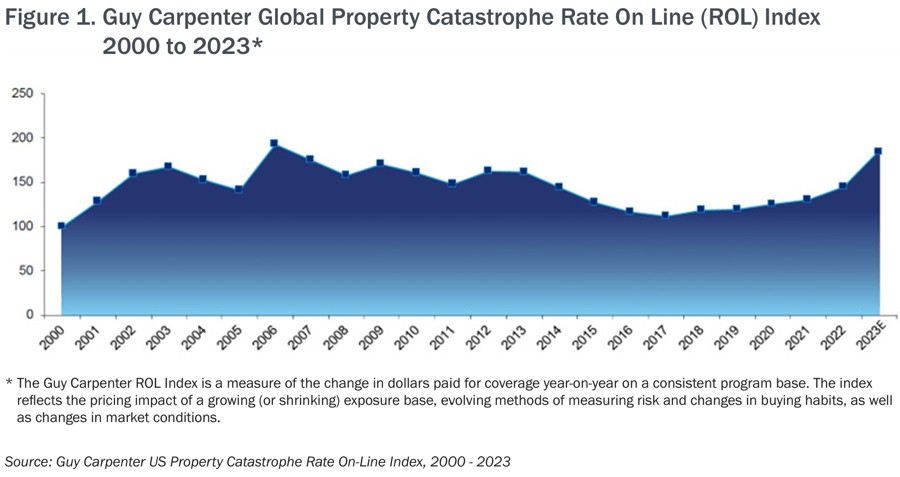
According to Guy Carpenter’s July 2023 reinsurance comments, “Property - A strong demand for limit persists, but market corrections have rebalanced the supply / demand disparity faced by many regions a year ago. Across the board, pricing is firm with a wide range of risk-adjusted rate changes seen throughout individual layers. Global property catastrophe reinsurance risk-adjusted rate increases ranged from +10% to +50%, with loss-impacted clients often seeing higher pricing. In the US, property catastrophe reinsurance risk-adjusted rate increases were on average the highest in 17 years, with loss- free accounts generally up +20% to +50%.
In many instances, cedents retained more risk rather than accepting unfavorable terms. While lower-layer capacity and aggregates remained highly constrained, new capital raised by existing market participants and growing appetite by other established reinsurers saw overall capacity levels rebound. The preliminary year-to-date Guy Carpenter US Property Catastrophe Rate on Line Index, an alternative measure of price change that incorporates the impact of structural adjustments and current views of risk on actual dollars paid, increased 35 percent for January through July renewals.” See Figure 1.
For the July 1, 2023 reinsurance treaty renewals, publicly available data suggests further rate firming and reduction of available catastrophic capacity. We believe several factors have been contributing to this trend:
- CAT loss activity in H1 of 2023 has been meaningful and above industry average. In addition, the late-year 2022 winter storm continues to emerge as more material than many markets expected which has led to continued upward pricing momentum in the property market in general.
- There are substantial unrealized losses on reinsurer investment portfolios.
- The imbalance of insurance carriers having better results than their reinsurers for the past several years, which was driven by a soft market cycle in reinsurance. This came from an environment of excess reinsurance capital combined with a consensus that poor underwriting results each year or two were just abnormalities in the typical cycle of the overall market performance.
- Market aggregate reinsurance capital levels further eroded from higher-than- expected frequency and severity of storm activity along with wildfire, freeze losses, and floods. Several consecutive industry loss events over the past few years have been collectively outside the normal expected return periods including the COVID-19 pandemic and resulting
These factors were compounded by the inflationary impact on loss costs due to the continued increasing global supply chain disruptions along with the continuation of the war in Europe. Many of these issues, combined with a general re-examination of climate change related impacts, resulted in the market significantly re-calibrating the value of underlying exposures and expected loss costs (in both frequency and severity). This has created a perceived “new normal” for climate change-related catastrophe impacts. In addition, we have seen retro capacity also tighten significantly. Various pricing and term adjustments have resulted in cedents continuing to take greater net retentions on their “per risk” programs throughout the reinsurance segment, requiring them to buy expanded CAT excess towers. At the same time, CAT reinsurers have continued to be more reluctant to support lower attaching layers of CAT towers, or these reinsurers are offering pricing where cedents would be more likely to retain these layers on a net basis. Given the expected increases in retained loss by the ceding companies in the face of greater loss expectation in the aggregate, primary companies have continued to raise rates, while also reducing limits, as a strategy for managing the potentially impending margin erosion. We are seeing cedents buying more vertical limit at the top of towers in response to increased PMLs (Probable Maximum Losses) driven by the impact of inflation on the underlying exposures.
Overall, risk-adjusted rate changes have ranged from mid-single digits to as much as 50% – 60% or higher since the beginning of 2023, which continued throughout the July 2023 treaty renewals. In general, we are seeing more instances where reinsurance terms and conditions are open to negotiation compared to prior years. These negotiations continued to show significant firming in both rates and premium per unit of exposure through Q2 2023, tighter contract language, reduced occurrence limits and tighter reinstatement provisions. On proportional programs, occurrence limit to premium ratios reduced in a meaningful way, and ceding commissions continued to decrease across many programs. Capacity shortfalls on “per risk” business seem to have instigated a shift in strategy and now weigh a greater proportion of CAT exposed reinsurance capacity towards CAT excess programs, with the expected margins in this space being viewed as the most improved. The tighter reinsurance underwriting has created what we expect will be a sustained, firming environment versus other recent periods of market firming, which were buffered in the past due to a soft reinsurance market. It remains to be seen how much new capital will flow into the property market over the coming quarters and to what extent this flow could change the industry outlook. The consensus is that new capital in-flows will not begin in a meaningful way unless reinsurance markets demonstrate healthy returns in the coming quarters.
It does appear an increase in ILS (insurance- linked securities) capacity and the property CAT excess of loss market has reached a pricing / capacity equilibrium point. The pace of rate change seen in the past two years might not continue at the same pace, yet there is still pain being experienced from claims payments throughout the property sector as confirmed by H1 reports. The continuation of the 2023 Atlantic hurricane season will be a possible signal as to what could be expected in quarters to come. At the end of 2023, the view of the property insurance industry’s willingness to further deploy capital should become clearer.
CATASTROPHE LOSSES
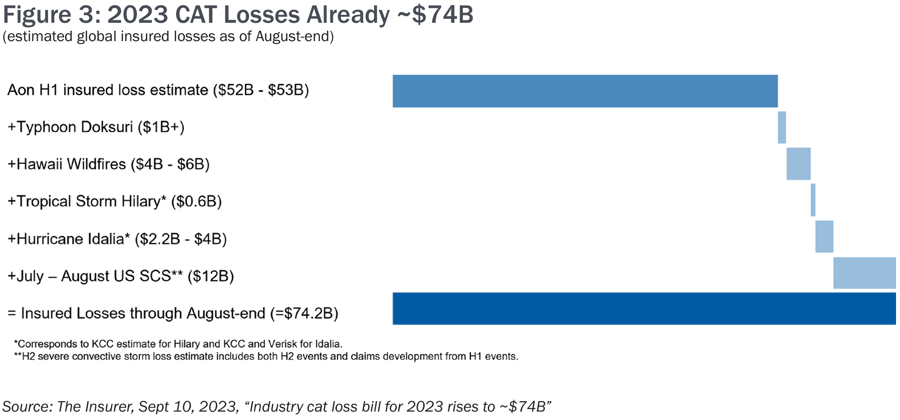
According to Aon’s “Global Catastrophe Recap - First Half of 2023”, the global insured losses from natural disasters in H1 2023 totaled $53 billion, which is 46% above the 21st-century average. Economic losses for the H1 2023 period amount to an estimated $194 billion, and already constitute 60% of the average annual global total. The data shows that just over 27% of total losses from nat cat events around the globe were insured in the first half of the year, leaving a large protection gap of $141 billion. So far, with the 21st-century average of total losses at $128 billion, this year marks the 5th highest on record and the highest since 2011.
Furthermore, Aon reported, “Insured losses were largely driven by severe convective storm activity in the United States with eight multi-billion-dollar events”, on top of the February earthquakes in Turkey, the single costliest disaster. Additionally, two back-to- back billion-dollar disasters impacted the North Island of New Zealand within a three- week period in the first quarter, resulting in losses exceeding $5 billion.
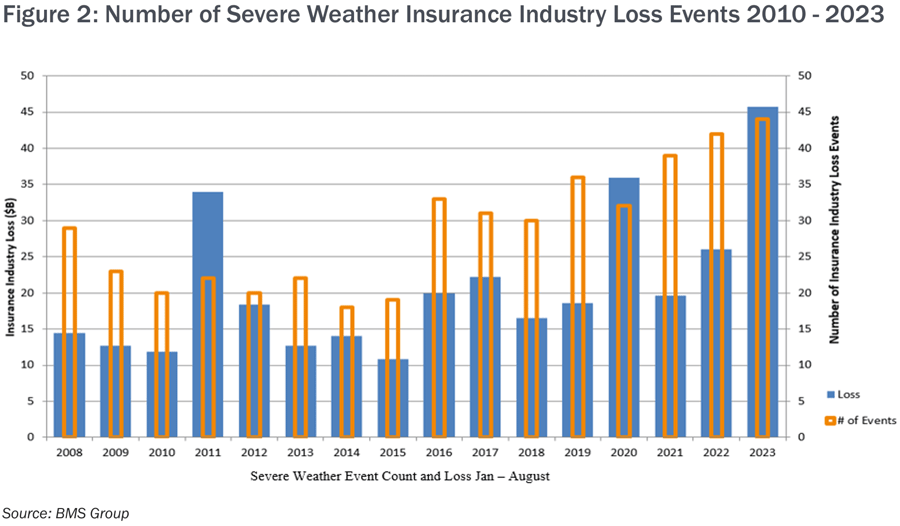
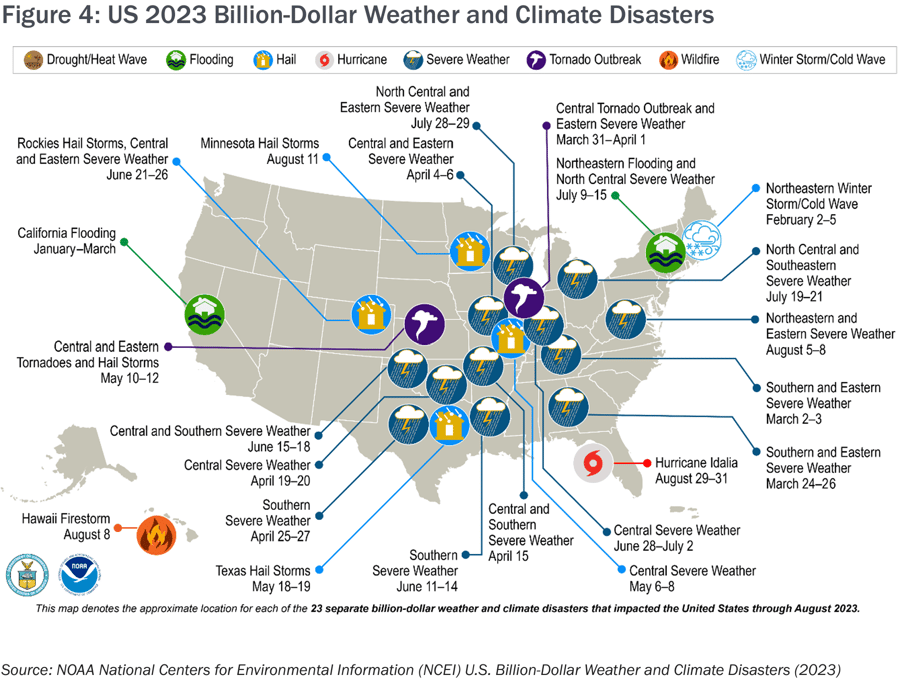
Since Aon issued its report listing a total of 18 events that resulted in at least $1 billion of insured losses in H1 2023, that number has increased to 23, the highest on record on a price-inflated basis. Major factors for these financial losses were that the disaster costs (particularly increased costs of labor and materials needed to effectuate repairs) continued to be affected by inflationary pressure, which is still persistent in many parts of the world, as well as other societal factors including demographics and wealth distribution. See Figures 2, 3 and 4.
FLORIDA LEGISLATIVE UPDATE
Florida has surpassed California to become the number one surplus lines market in the United States for the first six months of 2023 with over $8.6 billion in premium. The 2024 legislative session will begin in January with the changes passed throughout 2022 and 2023. Key legislative areas which passed during the regular session include:
- HB 837 – Comprehensive Tort Reform Package. Almost 300,000 claims were filed by plaintiffs’ attorneys the day before the law went into effect.
- Modified comparative negligence standard
- Clarified bad faith standard
- Modified “one way” attorney’s fees for all lines of business (Bill 2 A during the special session in December 2022 did
this for property insurance claims) - Modified the fee multiplier statue to only apply in rare and exceptional circumstances
- SB 7052 – Insurer There was dissatisfaction with claims handling post Hurricane Ian.
- 90-day post hurricane repair clause for authorized insurers
- Requires Citizens Property Insurance Corporation of Florida to cover properties with open claims being handled by FIGA (Florida Insurance Guaranty Association)
- HB 799
- Effective October 1, 2023, insurance companies that issue wind coverage and require a policyholder to have flood insurance must verify that the policyholder has flood insurance at the time the policy is issued or renewed. Master flood policies are acceptable.
2023 ATLANTIC HURRICANE SEASON
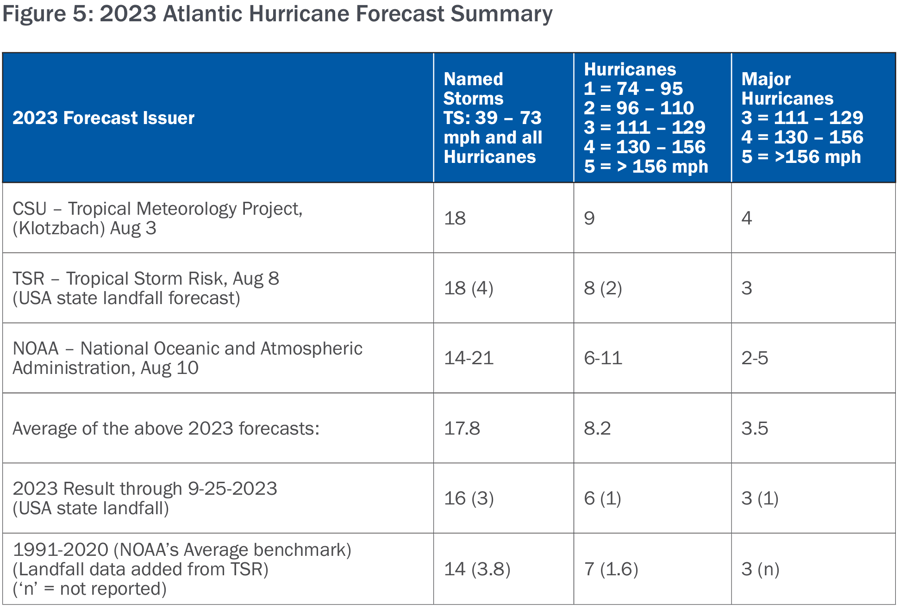
Three well known forecasters predicted a dramatic Atlantic hurricane season with their reports outlined before the season began. Each forecaster notes competing climate factors of El Niño inhibiting storms and the warm Sea Surface Temperatures (SST) supporting Tropical Cyclone formation. As of mid-August, the National Oceanic and Atmospheric Administration‘s (NOAA’s) Climate Prediction Center and El Niño- Southern Oscillation (ENSO) Diagnostic confirms El Niño conditions exist with a greater than 95% chance of El Niño continuing through February 2024. (See Table)
El Niño impacts tend to include increased trade winds across the Tropical Atlantic and increased vertical shear disrupting Atlantic Tropical Cyclones. Very warm SSTs support Tropical Cyclone formation, and so the conflict is on. The Colorado State University (CSU) Tropical Meteorology Project forecasts a robust El Niño yet says most of the tropical and subtropical Atlantic has record warm sea surface temperatures for this time of year, which is anticipated to counteract some of the typical vertical wind shear.
NOAA cites record-warm SSTs as a factor likely to counterbalance the usually limiting conditions of the El Niño event. Tropical Storm Risk also cites the warm SSTs but forecasts near neutral trade winds as an anomaly. The season opened with Tropical Storms Bret and Cindy being active at the same time, which was the first June since 1968 that two Atlantic tropical cyclones were underway at the same time.
Now that we are well into the 2023 season, we are seeing the impact of what was expected by these key agencies with the formation of sixteen named storms along with six hurricanes to date. The impact of the remaining months of this season will play a role in future capacity and pricing. See Figure 5.
SEVERE CONVECTIVE STORM
According to Insurance Business America July 2023 report, severe convective storms, once seen as a ”secondary peril,” played a dominant role in the losses during H1 2023, accounting for over 70% of the total US losses incurred. The active weather pattern caused widespread outbreaks across the US resulting in $34 billion in losses from convective storms - the highest ever for a six-month period and almost twice as high as the annual average the last ten years ($18.4 billion). (Source: Report reveals H1 natural catastrophe losses | Insurance Business America / insurancebusinessmag.com)
WILDFIRES
Through September, year-to-date acres burned for the US remains well below the 10-year average at just under 40%, with a slightly below average number of fires as well, about 97% of average, according to the NIFC’s Monthly Seasonal Outlook. Yet, underwriters continue to take a longer view and continue to be very selective in wildfire exposed areas. Most underwriters require positive underwriting features of superior construction, clear space, and mitigation. The current approach by underwriters to the wildfire hazard is reinforced for many from the smoke of the worst Canadian wildfire season on record (per the Canadian Interagency Forest Fire Center), from the extended record-breaking heat wave in the Southwest and West, bringing widespread drier than normal conditions curing fuel, and from the tragic fires in Maui in August. Regionally, drought conditions are expanding in Washington and Oregon. Wildfire related risks will continue to be challenging to place. See Figure 7.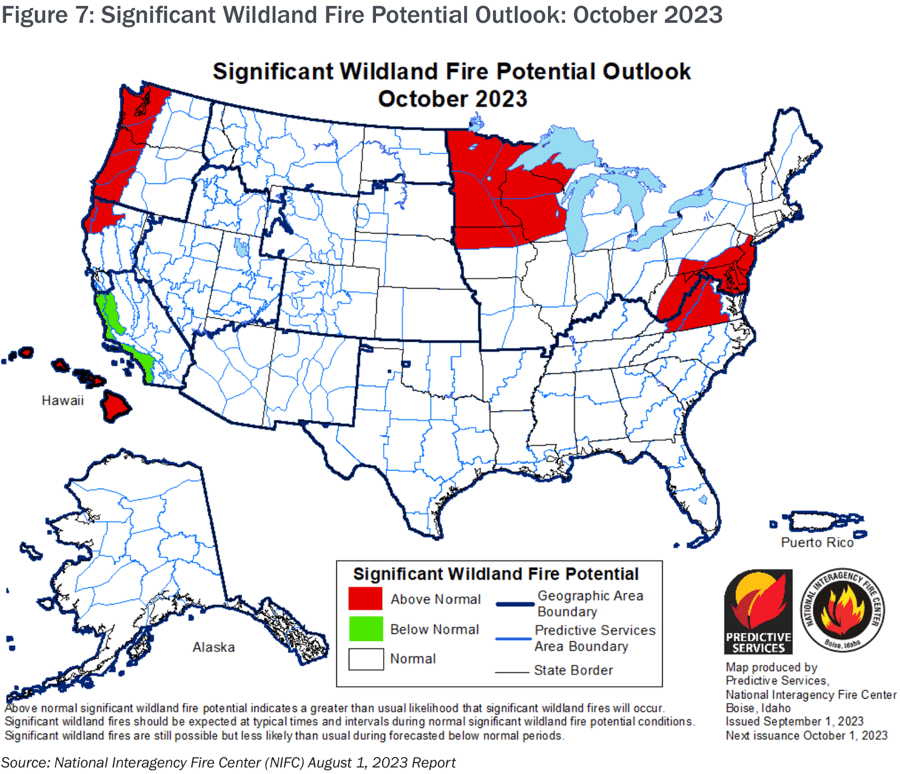
HAWAII WILDFIRES AND THEIR IMPACTS
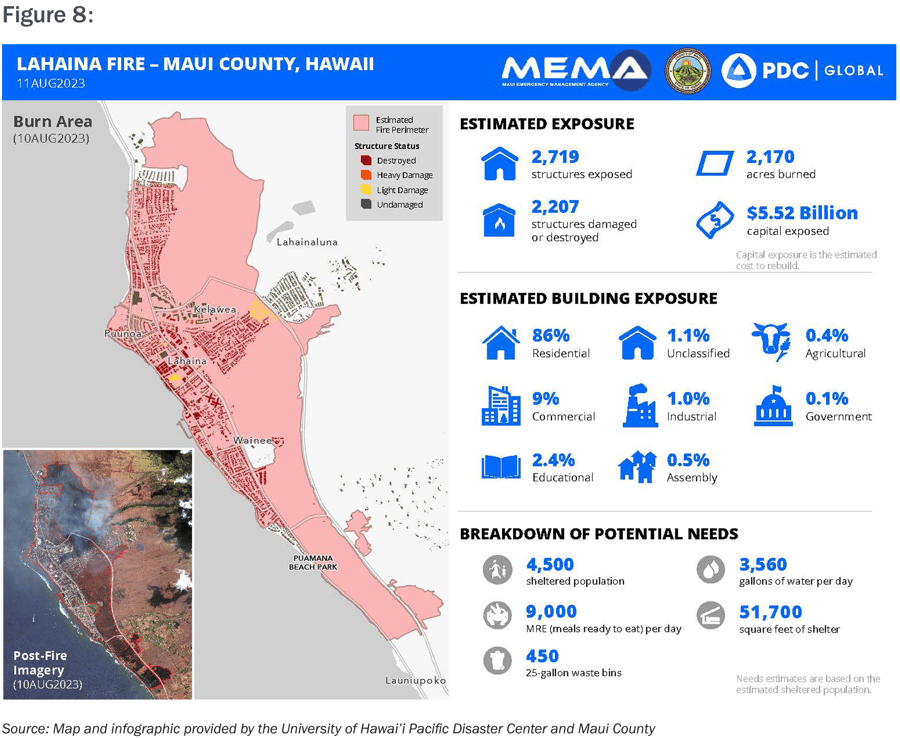
Ongoing severe drought across the Hawaiian Islands, combined with an abnormally dry air mass and strong winds related to the pressure gradient force between a high- pressure system to the north and Hurricane Dora as it passed 500 miles to the south with peak gusts of 67 mph in Maui, set the stage for dangerous wildfire conditions between Monday, August 7th and Friday, August 11th. The town of Lahaina on Maui Island sustained catastrophic damage, with more than 2,200 structures damaged or destroyed and over 2,100 acres burned, making the Lahaina fire the most destructive wildfire in Hawaii’s history. The death toll from the Lahaina fire sits at 97, making this the deadliest U.S. wildfire in over 100 years. See Figure 8.
MARKET SPOTLIGHT: VALUATION / INFLATION
For several years, insurance and reinsurance markets have been requiring higher minimum square foot valuations than were previously accepted. With the continued hardening of the marketplace, the issue is now paramount. Explaining to insureds why they are facing increased rates that are magnified by potentially increasing property values can be difficult. Below are a few highlights causing change in this area. Please note, these are not all inclusive as to the reasons for the current situation.
Soaring construction demand: Even though the National Association of Home Builders (NAHB) predicts that the multifamily starts will fall in 2023 after a record level in 2022, there are still 943,000 apartments currently under construction in the United States, the highest since 1974.1 This new construction is already putting a strain on a weakened, yet stabilizing, supply chain which drives up the cost of repair for damaged properties.
Labor shortages: According to the National Center for Construction Education and Research (NCCER), the US currently lacks 430,000 construction workers and has only recovered 67% of the jobs lost during the pandemic.2 Career changes during the pandemic, an aging workforce increasing the number of retirements, higher wages elsewhere, fewer immigrants and time constraints are all contributing to this shortfall. This competition for labor has led to a 5.5% labor cost increase year-over-year, and the deficiency of workers is forecasted to increase to 546,000.3
Supply chain uncertainty: While conditions have improved post-COVID as respects availability, there are other factors affecting supply chain reliability.
- Severe drought in the Panama Canal, through which 40% of the world’s cargo passes, has necessitated restrictions on vessel crossings resulting in delays of 15 days or more. With the drought expected to continue well into 2024, shippers are considering alternate routes such as the Suez Canal.4
- Stateside, delays are improving as the West Coast Port Workers recently ratified their union contract avoiding a potential strike; East & Gulf Coast contract talk continues.5 Once the cargo is unloaded, there are further issues inland with rail and trucking. For example, in June 2023, GM announced they were cutting back on production due to a rail car shortage.6
- The American Trucking Association estimates that the shortage of drivers, which was around 78,000 in 2022, and could surpass 160,000 by 2031.7
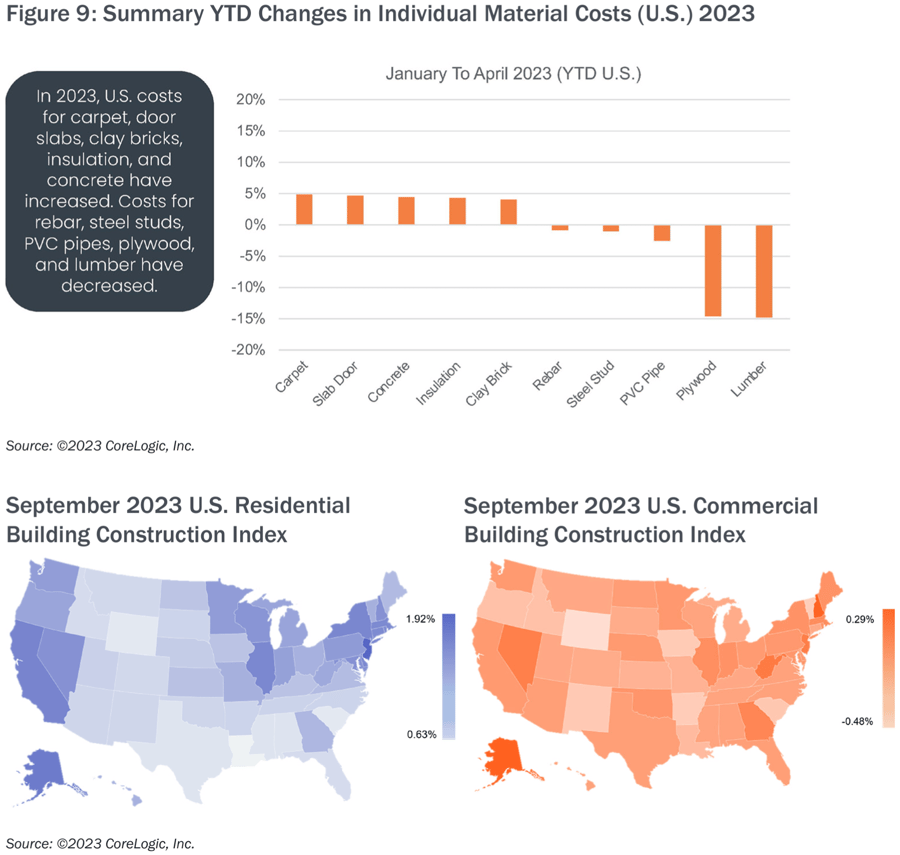
Material costs: While costs for lumber have seen a recent decrease by 15% YTD in the U.S.,8 Oxford Economics suggests construction material costs could be at least 15% higher than pre-pandemic levels when prices bottom out; and potentially even higher than the estimate due to inflation pressures.9 See Figure 9.
Deficient valuations: “The insurance market has already seen a number of claims where there has been a significant gap between the insured’s declared value and the actual replacement value. For example, in a claim for a commercial property destroyed in the 2021 Colorado wildfires, the rebuild value was almost twice the declared value, due to a combination of inflation, demand surge and underinsurance.”10
Sources
1 Multifamily Housing Projected to Weaken in 2023 | Multifamily Executive Magazine
2 The Greater Impact of the Construction Labor Shortage Examined - NCCER
3 Finance & Commerce, Report Shows Construction Material Prices Moderating, Labor Costs Up, August 2023, Finance-commerce.com
4 Supply Chain Dive, Panama Canal delays have shippers mulling freight diversions, August 2023, supplychaindive.com
5 Advertising Specialty Institute, West Coast Port Workers Ratify Contract, September 2023, asicentral.com
6 GM Authority, GM Production Reduction Planned Due To Rail Car Shortage, June 2023, gmauthority.com
7 Transport Topics, Driver Shortage Decreases Slightly to 78,000, ATA , October 2022, ttnews.com
8 CoreLogic, Quarterly-Construction-Insights-Q2-2023.pdf, Q2 2023, corelogic.com
9 Oxford Economics, Construction-futures-2023.pdf, March 2023, oxfordeconomics.com
10 Risk Management Magazine, How Inflation Is Impacting Insurance Claims and Asset Valuation, October 2022, rmmagazine.com
COVERAGE SPOTLIGHT: BUILDER’S RISK
Two areas of market concern in the Builder’s Risk segment are wood frame projects and resistance to project policy extensions by market trading partners.
The builder’s risk market is meeting the demand in certain areas of wood frame capacity yet other segments remain challenging amid a strained and sustained hard E&S property market. One pocket of possible temporary relief is the leveling of capacity for builder’s risk coverage relating to wood frame projects.
Capacity for smaller wood frame projects has stabilized for the moment yet capacity has been more restricted for single structure large projects. Capacity, terms and conditions could be affected in the months to come by recent large wood frame construction fires. Elsewhere, many segments of the property market remain challenging.
Many frame builder’s risk projects are placed in the E&S segment and capacity has leveled off to become more adequate based upon demand. Terms, conditions and pricing all vary depending upon location, possible catastrophe exposures and size of the project.
Yet while capacity constraints have somewhat eased in that segment of the construction property market, strong demand for capacity to support complicated renovation projects is being met by diminished carrier appetite. In addition, extension coverage for builder’s risk policies continues to be a significant challenge.
Many large projects have two- to three-year projected timeframes. With the supply chain shortage experienced over the last couple of years, insureds continue to require policy extensions on large projects. Several MGAs that focus on builder’s risks have amended their capital provider participants which can prevent them from giving automatic extensions of the policy, which can become a significant challenge within the builder’s risk segment.
Adding new markets to extend a builder’s risk policy can possibly result in very large rate increases from what was originally negotiated at the start of the project. To address this possibility, expectations must be managed early in the process.
Information should be assembled for underwriter review 90 days prior to the policy expiration date. Details needed may include updated itemized schedule of values, protection status, photos and more.
THE RT SPECIALTY PROPERTY COMMITMENT
“Specialization continues to be a key focus of RT Specialty today and for the foreseeable future. During challenging property market cycles like the one we are currently experiencing – and have been for some time now – the need for specific expertise becomes all the more apparent. The RT Property team has an excellent and deep talent pool of experienced brokers who understand the challenges faced today by our retail broker trading partners and their insureds. Through collaboration, hard work, and our commitment to excellence, the RT Property team stands ready to provide best in class assistance to our trading partners,” says Brenda (Ballard)
Austenfeld, CEO & President of RT Specialty’s National Property Practice.
CONTACT
For more information, please contact your local RT Property broker.
RT Property is a part of RT Specialty. RT Specialty is a division of RSG Specialty, LLC, a Delaware limited liability company based in Illinois. RSG Specialty, LLC, is a subsidiary of Ryan Specialty, LLC. RT Specialty provides wholesale insurance brokerage and other services to agents and brokers. As a wholesale broker, RT Specialty does not solicit insurance from the public. Some products may only be available in certain states, and some products may only be available from surplus lines insurers. In California: RSG Specialty Insurance Services, LLC (License #0G97516) ©2023 Ryan Specialty, LLC
This Article is provided for general information purposes only and represents RT Specialty’s opinion and observations on the current outlook of the US Property Insurance market and does not constitute professional advice. No warranties, promises, and/or representations of any kind, express or implied, are given as to the accuracy, completeness, or timeliness of the information provided in this Article. No user should act on the basis of any material contained herein without obtaining professional advice specific to their situation.